1. Objective
Transport is a main sector for the global development of the economy in any single corner of this world, one of them and a very imperative one is it guarantees the mobility of citizens, it also constitutes a basic tool to increase the performance of the productive sectors. The purpose of this document is to propose a strategy that helps to initiate a data analytics implementation of the “National Survey for Wales, 2013-2014: Transport”.
2. General Overview About Wales and Its Transport System
Wales is located on the Island of Great Britain, west of England and its area is about half the size of the Netherlands, density averages are 150 people per square kilometre; most of the Welsh landscape is protected, there are not many straight roads in Wales, due to the mountains. “The dominant mode of travel in Wales is currently provided by the private car “, (Welsh Assembly Government, 2008) and apart from that, the transport key is a railway network, cycling, walking, road transport, motorcycling and air transport.
3. Data Handling Process
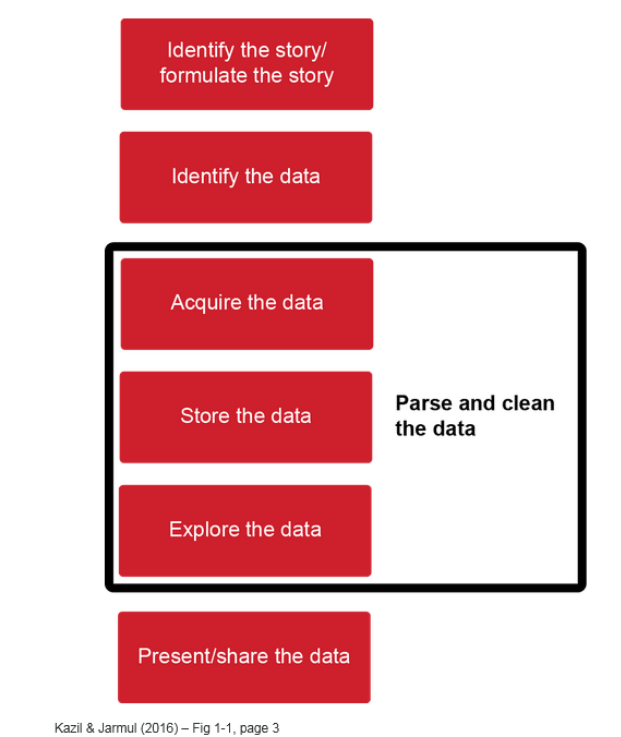
To work with data, we must consider the different stages of data processing and it refers to the entire process followed by a researcher from the collection of data, until the presentation of the same, in a summary form. Have basically three stages: collection and entry, processing, and presentation; for the scope of this project, we will use the steps proposed by Kazil & Jarmul (2016)
3.1 Identifying the story
Since, we will be analysing the results provided by the National Survey of Wales, we will explore, understand, describe, and identify areas of opportunity in the transport system of Wales. for the results extracted from the Department of Statistics, National Survey Team, 2013-14 and via the University of Essex Online. We will start describing the current scenario through the overall results and then we will deep-dive in the bivariate analysis to identify any inflection points, we will finalize our data implementation with few recommendations.
3.2 Identifying the data
Data set provided by the University of Essex Online is not the latest release; newest version available was updated in July 2022. National Survey was conducted by TNS-BMRB and Beaufort Research on behalf of the Welsh Government (Welsh Government, 2014). Results by year are available on the website of the Government of Wales from 2012, containing relevant information about active travel, internet access and use, personal finances, trust in people and institutions, local authority services, experience of GP (general practitioners) and hospital services, satisfaction with health services, transport and so on. According to the technical background provided on the website of the Government, for this survey, “just over 24,000 addresses were chosen randomly from the Royal Mail’s Small User Postcode Address File. Interviewers visited each address, randomly selected one adult (aged 16+) in the household and carried out a 25-minute face-to-face interview with them. A total of 14,771 interviews were achieved. This equates to a response rate of 70%.”, (Welsh Government, 2014).
3.2.1. Data set review
- 42 summarized tables with the results of the survey. Overall satisfaction is 5.9
- About 15 unique indicators such as: Household type, have use of a car, gender, urban or rural area, local authority, public services footprint, etc., with overall results (average of the overall satisfaction with state of transport, average of satisfaction with life and percentages), see Figure 1.
- 4 groups of tables with a certain variable combined with some others such as: have use of a car split by gender, have use of a car split by urban/rural area, have use of a car split by WIMD deprivation score, etc. See Figure 2 to Figure 5.
- The sample size variates because, the results are based on only surveyed only who answered the questions.
3.2.2. Variables understanding
As a person who has been working as a data analyst for over than 10 years, understand every single variable is a key, it will help us to comprehend behaviours, paths and so on:
| Variable Name | Variable Type / Remarks | |
|---|---|---|
| Household | Qualitative, ordinal; single pensioner (no children), married couple (no children), etc | |
| Have use of car | Qualitative, nominal; yes or no | |
| Urban/rural area | Qualitative, nominal | |
| Local authority | Qualitative, nominal | |
| Public services footprint | Qualitative, nominal | |
| WIMD deprivation score | Quantitative, continues, ratio; WIMD is used as the official measure of deprivation | |
| WIMD access to services score | Quantitative, continues, ratio | |
| Satisfaction with life (low or high) | Quantitative, discrete | |
| Age | Quantitative, discrete | |
| Employment status | Qualitative, nominal | |
| Local area is free from heavy traffic | Qualitative, ordinal | |
| Feeling of safety of travelling by public transportation after dark | Qualitative, ordinal | |
| General health | Qualitative, nominal; very good, good, fair, bad, very bad, etc | |
| ACORN classification | Qualitative, nominal; wealthy achievers, urban prosperity, comfortably off, etc | |
| Ease of getting to and from GP surgery | Qualitative, nominal; very easy, fairly easy, fairly difficult, etc. | |
| Ease of getting to and from hospital | Qualitative, nominal | Qualitative, nominal; very easy, fairly easy, fairly difficult, etc |
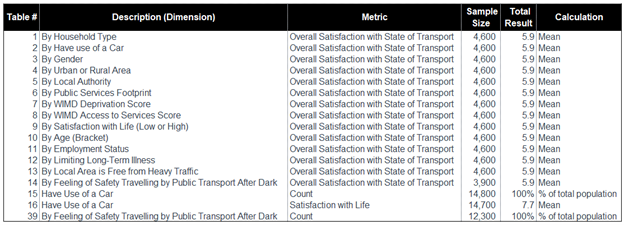
Figure 1: Overall metrics, univariate analysis
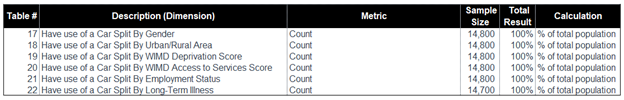
Figure 2: Have use of a car, bivariate analysis
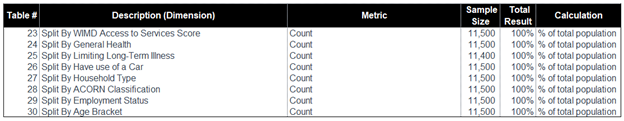
Figure 3: Easy of Getting “To” and “From” GP Surgery, bivariate analysis
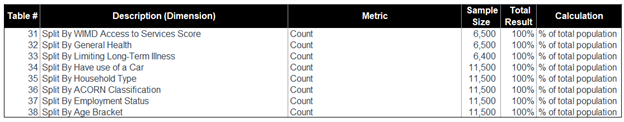
Figure 4: Easy of Getting “To” and “From” GP Surgery, bivariate analysis
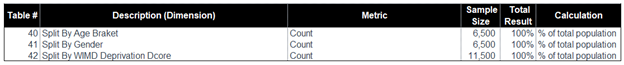
Figure 5: Feeling of Safety Travelling by Public Transport After Dark, bivariate analysis
3.2.3. UML Survey System
UML diagrams help to specify and visualize models of software systems, including its structure and design, in the Appendix A, there is a proposal of the UML survey system, which includes question type examples, and it assumes the current model of the National Survey for Wales (interviewers visiting each address).
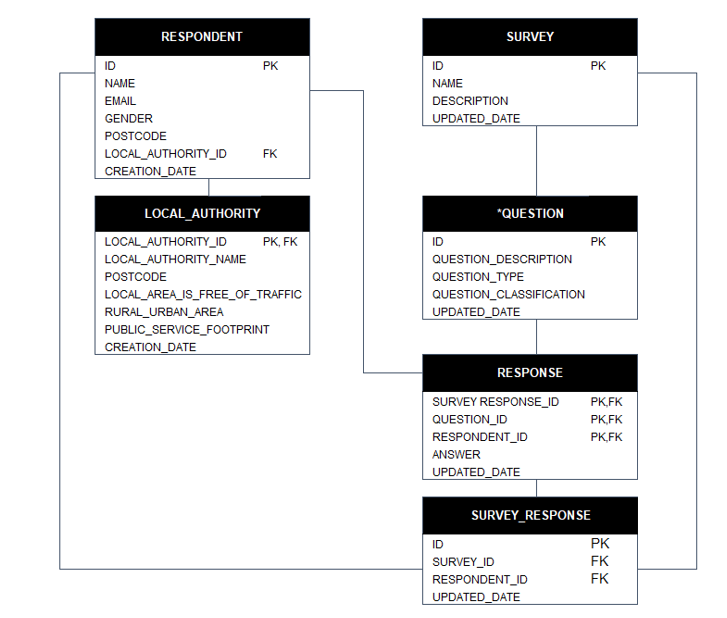
Figure 6: Highlevel Survey System
Question Classification Examples
- Multiple Choice Question
- Rating Scale Question
- Ranking Question
- Open-ended Question, etc
Question Type Examples
- Address Check:
- Serial Number
- Address Confirmation
- Name of Police Station Registered at
- Sexual Orientation
- Religion
- Household Type (Table 1, Table 27 and Table 35)
- General Demographic Question:
- Country of birth
- Nationality
- Ethnicity
- Religion
- Qualifications
- Gender Confirmation (Table 3, Table 17 and Table 41)
- Marital Status
- Respondent Relationships
- Car use (Table 2, Table 15 to Table 22 and Table 34)
- Employment Situation
- Employment Situation (Table 11, Table 21, Table 29, Table 37)
- Others
- Health Questions:
- Questions about health conditions, illness, or impairments (Table 12, Table 22, Table 25, Table 33)
- Opinions on local health services
- GP Services: such as accessibility from to GP surgery (Table 23 to Table 30)
- Hospital Services: such as accessibility from to Hospital Services (Table 31 to 38)
- Others
- Satisfaction With
- Education System
- Health Services
- Transport System
- Life
- Others
3.3 Parsing and cleaning the data (acquiring, storing, and exploring the data)
It is, as its name implies, the debugging of bad data in a table or database. This action will permit us to identify incorrect, incomplete, or irrelevant data; after cleaning, the unusable data is replaced, modified, or completely deleted.
At this point, this data is already parsed, cleaned up and even digested. Essentially, we have been provided with measures of central tendency, such as the mean of the overall satisfaction with state of transport in Wales; measures of frequency distribution, such as the occurrence of the datasets; measures of variability describe the dispersion of the data set, such as the coefficient of variation and so on; statistically talking, we have been provided with univariate analysis and bivariate analysis (which describes the relationship between pairs of variables), an example of bivariate analysis is the table 17: have use of a car, by gender.
Due to the nature of this dataset, variable types and the information revised, for the exploration part I will be focused on the interpretation and visualization of the information provided and thus, I will grant a friendly and condensed description of the tables and observations that have been made, availing of descriptive statistics and some of its graphic representation. Just a gentil reminder, “descriptive statistics are brief informational coefficients that summarize a given data set, which can be either a representation of the entire population or a sample of a population”, (Hayes, 2022).
Ideally, we should be exploring the latest survey release to generate insights, anyhow this is a good educational example to understand the data handling process and evaluation that we will be actively applying during the next modules. Data exploration help companies or institutions quickly explore large amounts of data to better understand the next steps in terms of further analysis. This gives us a more manageable starting point and a way to target areas of interest. In most cases, data exploration involves using data visualizations to examine data at a high level. By taking this high-level approach, we will be able to determine which data is most important and which will distort the analysis and therefore need to be removed. Data exploration can also be helpful in reducing time spent on less valuable analysis by choosing the right path from the very beginning.
3.4 Present/share the data
Implementation will be shared in another post, very soon!
References
Welsh Government (2014). National Survey for Wales headline results: April 2013 to March 2014. [online] GOV.WALES. Available at: https://gov.wales/national-survey-wales-headline-results-april-2013-march-2014 [Accessed 15 Nov. 2022].
Welsh Government (2022). Transport & Travel / Wales. [online] www.wales.com. Available at: https://www.wales.com/transport-travel [Accessed 14 Nov. 2022].
Kazil, J. and Jarmul, K. (2016). Data wrangling with Python. Sebastopol, Ca: O’reilly Media.
Hayes, A. (2022). Descriptive Statistics. [online] Investopedia. Available at: https://www.investopedia.com/terms/d/descriptive_statistics.asp [Accessed 20 Nov. 2022].
Dataset is available here!