Resources for Understanding and Exploring K-Means Clustering Algorithms
K-means clustering is classified as an unsupervised machine learning technique due to its fundamental characteristic: it does not require labelled data for training. Unlike supervised learning algorithms that rely on labelled examples to learn patterns and make predictions, unsupervised learning algorithms, such as K-means, work on unlabelled data. The primary objective of K-means is to identify clusters of similar data points based solely on the patterns and relationships within the data itself (Vattani, 2011).
Figure 1: K-means clustering animation, starting with 4 left-most points.
Source: Shabalin (2007)
Figure 1 shows an animation by Shabalin (2007), in this animation, the process begins with the placement of the first cluster centroids, suggesting that four first centroids are chosen. These first centroids are crucial as they define the starting points for the clustering process. The animation would then prove how the algorithm continues in two alternating steps:
• Reassign Points: In this step, each data point is assigned to the cluster whose centroid is closest to it. The animation would show how each data point changes its affiliation to clusters based on the proximity to the current centroids. • Update Centroids: After reassigning points, the centroids of the clusters are updated. This involves recalculating the position of each cluster’s centroid as the mean (average) of all the data points assigned to that cluster.
The animation would iterate between these two steps until convergence, which occurs when the centroids no longer move significantly, or when data points stop switching clusters. Throughout this process, the animation would visually stand for how data points move between clusters and how centroids adjust their positions to minimize the distance between themselves and the data points. In a second animation (see Figure 2), author suggests the convergence properties of K-means, its dependence on first centroid positions, and the potential for multiple solutions based on different initializations.
Figure 2: Visualising K-means clustering for uniform points.
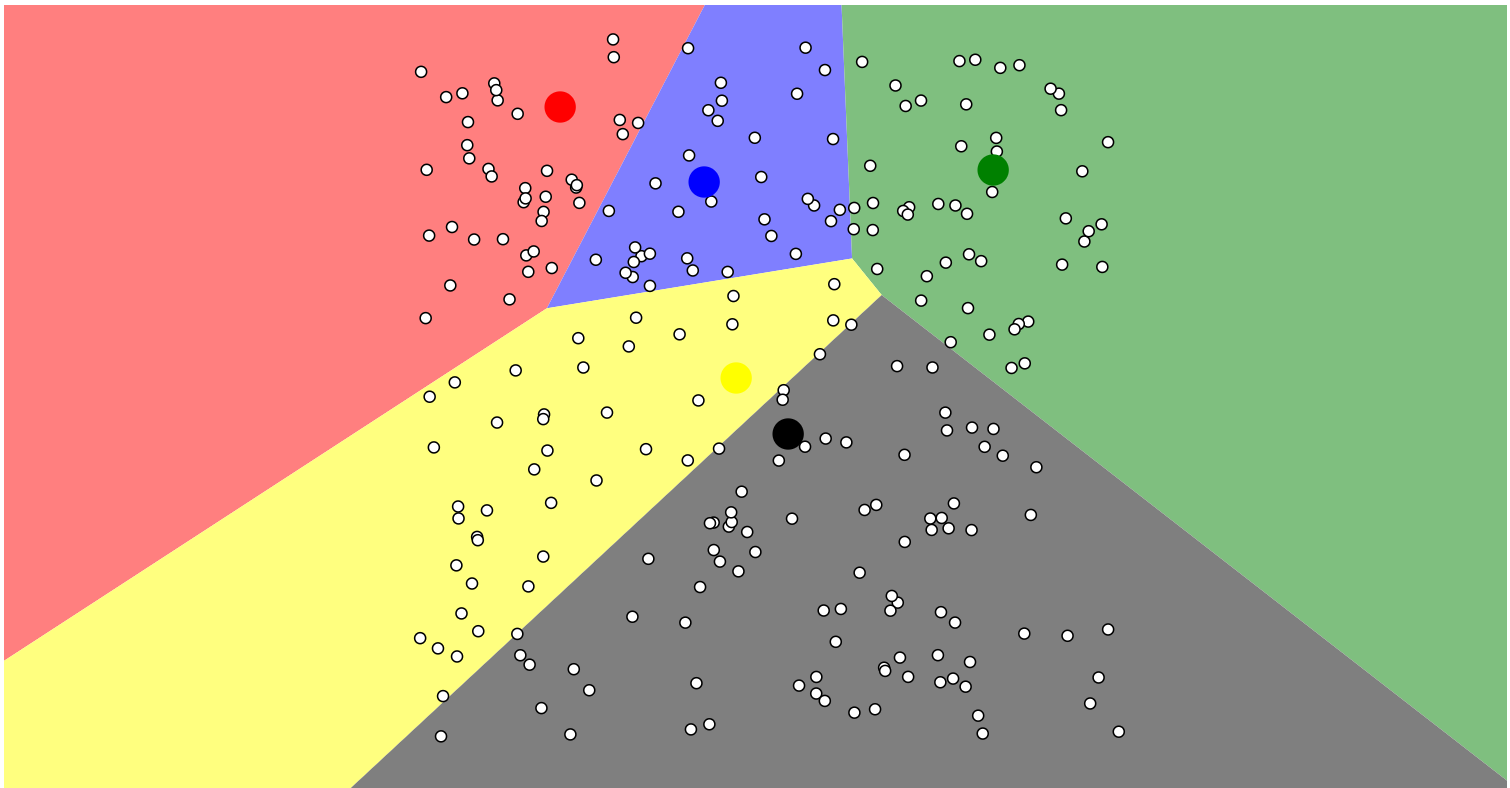
Source: Harris (2014)
Additionally, the text (Harris, 2014) explores various initialization strategies, including random selection, the “farthest” heuristic, and the k-means++ method. K-means clustering, faces challenges in scenarios such as “Uniform Points” where data points are evenly distributed, lacking distinct clusters. K-means may struggle to identify meaningful groupings in such situations, potentially leading to the creation of artificial clusters or failing to uncover genuine patterns. Its inherent assumption of spherical and equally sized clusters can limit its performance in scenarios with non-uniform data distributions. Animations like these provide a dynamic and visual representation of the algorithm’s operation. They help users grasp the iterative nature of K-means and how it gradually converges to form clusters based on the initial centroids and the data’s distribution.
References:
Harris, N. (2014). Visualizing K-Means Clustering. [online] Naftaliharris.com. Available at: https://www.naftaliharris.com/blog/visualizing-k-means-clustering/ [Accessed 27 Dec. 2023].
Shabalin, A.A. (2007). K-means clustering, starting with 4 left-most points. [online] shabal.in. Available at: https://shabal.in/visuals/kmeans/2.html [Accessed 27 Dec. 2023].
Vattani, A. (2011). k-means Requires Exponentially Many Iterations Even in the Plane. Discrete & Computational Geometry, 45(4), pp.596–616. doi:https://doi.org/10.1007/s00454-011-9340-1.